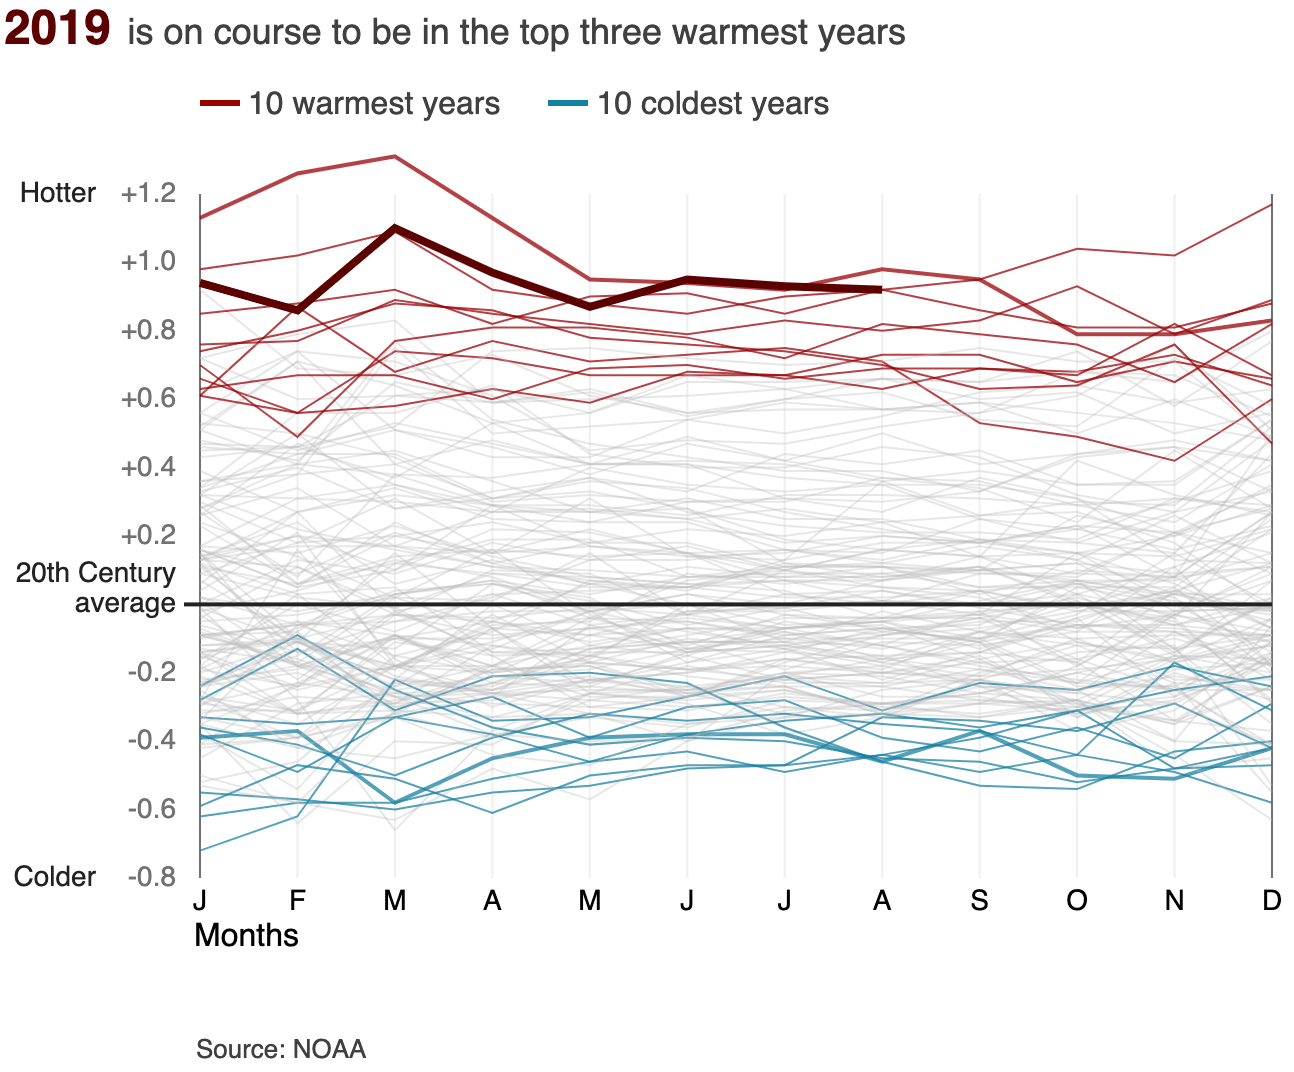
Read this interesting article about climate change.

1. The world has been getting hotter

2. The year 2018 set all sorts of records
This year saw record high temperatures in many places across the world amid an unusually prolonged period of hot weather.
Large parts of the northern hemisphere saw a succession of heatwaves take hold in Europe, Asia, North America and northern Africa - a result of strong high pressure systems that created a "heat dome".
Over the period shown on the map below (May to July 2018), the yellow dots show where a heat record was broken on a given date, pink indicates places that were the hottest they had ever been in the month shown, and dark red represents a place that was the hottest since records began.

No hay comentarios:
Publicar un comentario